Business Challenges Solved by QPM
In this article, we have collected the most common questions about QPM’s functionality that our clients frequently ask.
1. What fundamentally differentiates QPM from traditional task managers?
QPM is a unified platform that combines the strategic, tactical, and operational levels of project management. It is not just another task tracker, but a different way of thinking about and structuring how teams work. At the core of QPM are smart algorithms for autoplanning and autoassignment, enabling efficient plans without errors, chaos, or constant manual control.
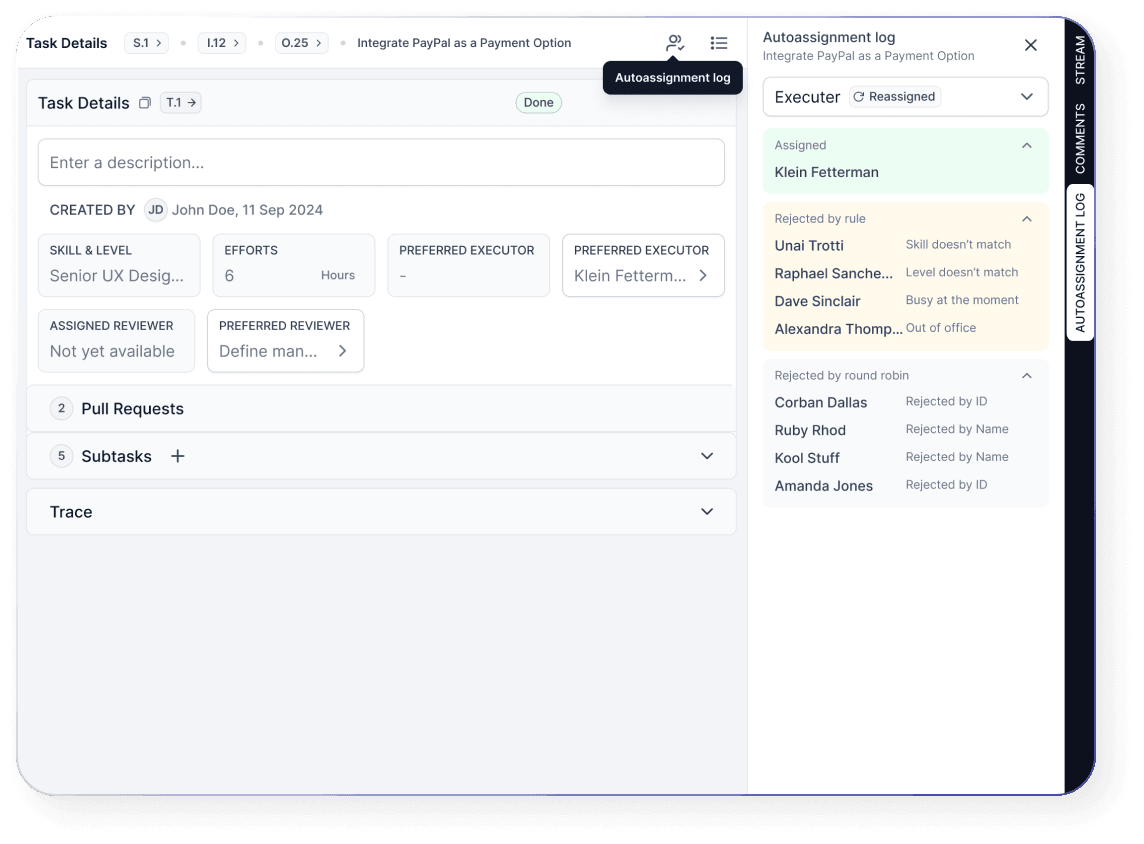
How does it work? The key principle is skill-based matching. Each user in the system has their skills and competency level defined, from junior to lead. During planning and automatic task distribution, QPM takes these parameters and previous experience into account. If a task returns for revision, priority is given to the person who has already worked on similar tasks. As a result, the system automatically assigns the task to the most suitable candidate — without manual decisions.
2. What does the workflow in QPM look like?
QPM can be structured in different ways, depending on your business reality and how your teams operate. Everything is built around Streams. They can represent teams, projects, or products. Each stream consists of Objectives — goals. These can be strategic tasks for a team or stages in product development. For every objective, you assign a business weight, allowing the system to understand what matters most to you and take this into account during planning. Objectives are then broken down into iterations (or sprints, if you prefer), within which tasks are created. Each task specifies the skills required to complete it.
And this is where the real magic begins. QPM automatically:
- considers the scope of tasks
- distributes them across available resources
- assigns executors
- sets priorities
- establishes dependencies between tasks
- and calculates realistic completion timelines
And this is only part of what the system can do.
3. How to Reduce the Risk of Missing Deadlines?
Missed deadlines usually don’t start during execution — they begin much earlier, at the stage of task distribution and planning. When tasks are assigned manually, and timelines are estimated without considering real workloads and people’s availability, even a well-designed plan quickly loses stability.
In QPM, this risk is reduced at the system level. Autoassignment distributes tasks based on roles, skills, and the team's current workload, eliminating common mistakes in manual task allocation. Autoplanning, in turn, determines timelines and the execution sequence by accounting for dependencies, calendars, and resource availability.
As a result, planning stops being an assumption. It becomes a calculation in which deadlines are based on real constraints rather than expectations.
4. How Can You View Team Progress, Performance, and Efficiency?
Team Monitoring, Relations Diagram, and Gantt Diagram tools allow you to instantly understand the current situation without additional reporting.
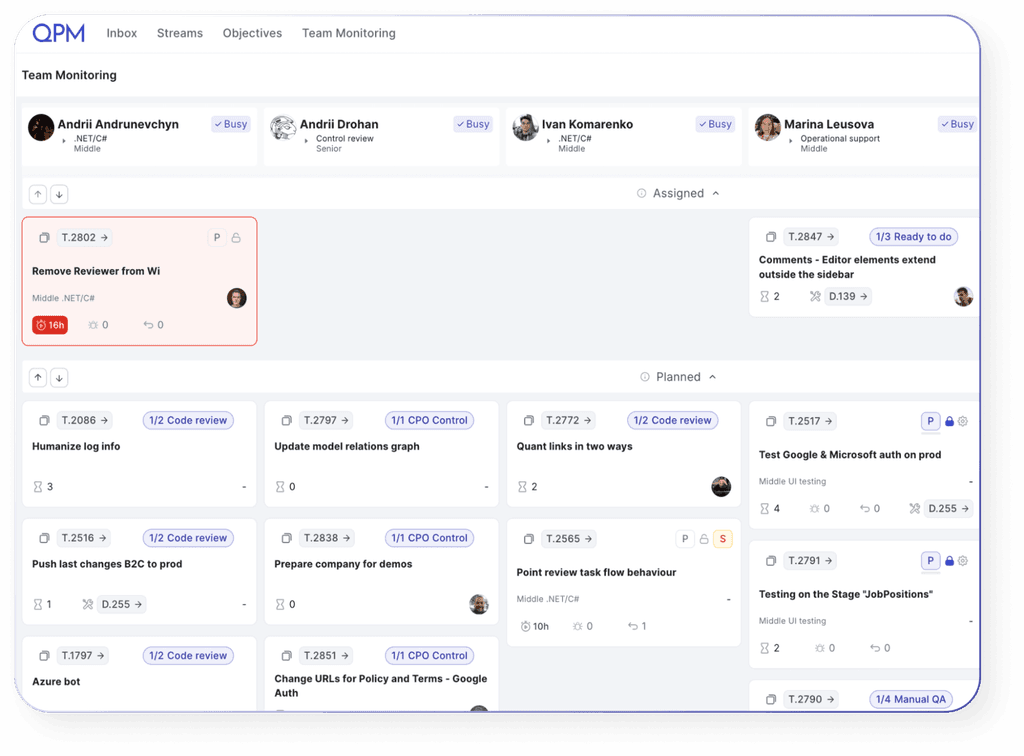
How Does Team Monitoring Work in QPM?
It’s quite simple. Team Monitoring automatically displays key operational data about your team: who is working on which tasks, current workload levels, task statuses, potential delays, and employee availability. You no longer need to manually check the status of work or collect information from multiple sources. On a single screen, you can see who is busy, where overloads occur, or where idle time may be. All information is updated in real time, reflecting the current status of tasks, vacations, sick leave, and other changes to availability. In essence, it’s a quick way to understand what is really happening within the team.
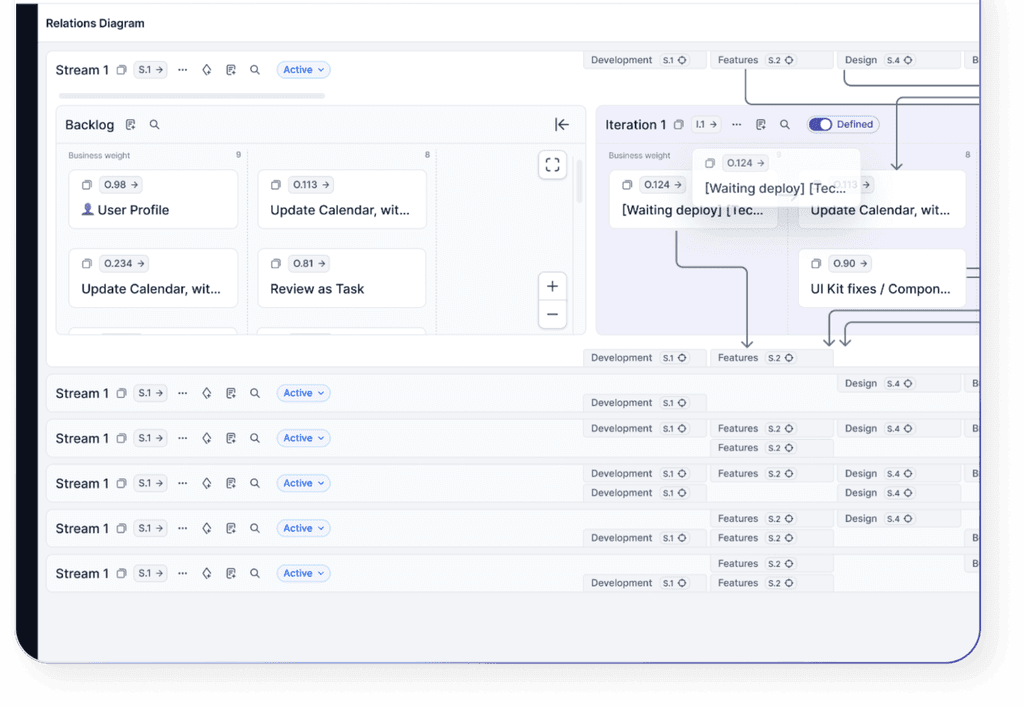
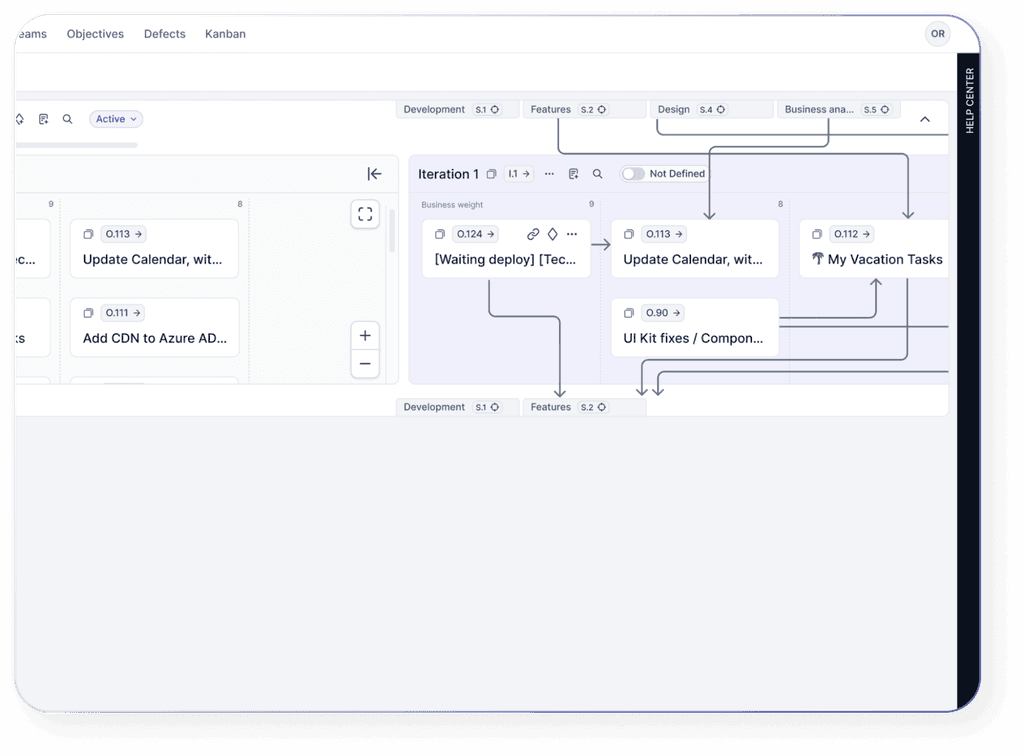
What Is the Relations Diagram Used For?
The Relations Diagram in QPM helps you see the workflow logic, not just a list of tasks. It shows how everything is connected: what depends on what, where delays may occur, and which tasks actually affect deadlines. This is especially valuable in complex projects with multiple parallel processes and teams. You can quickly understand what might block progress and how changes in one area may impact others. Essentially, it is a tool for proper dependency management and effective planning — allowing you to see the whole picture rather than isolated fragments.
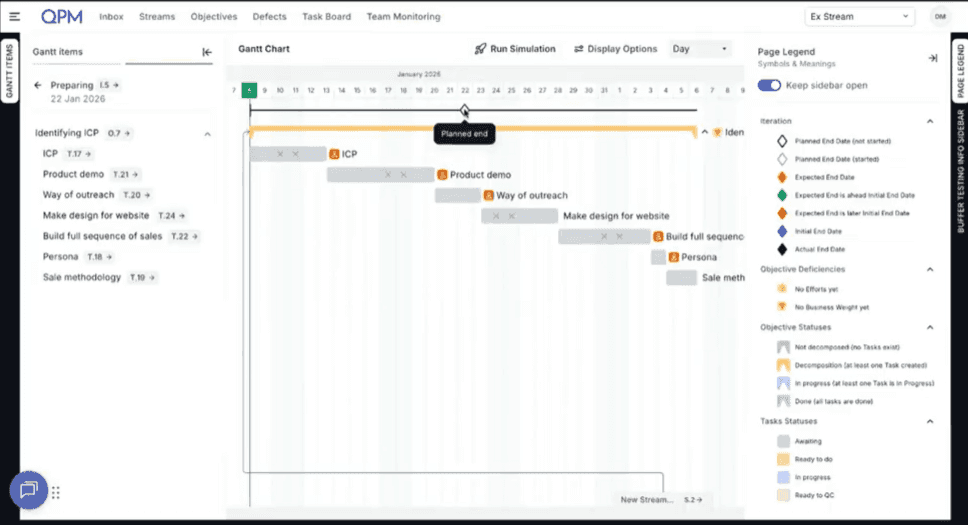
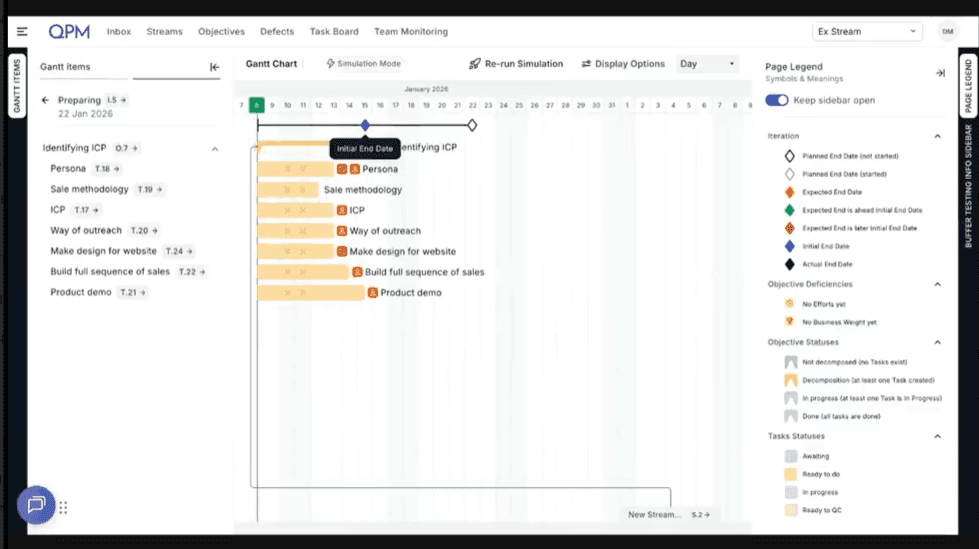
5. What Makes the Gantt Diagram in QPM Unique?
The Gantt Diagram in QPM is not just a visualization of tasks, it is the result of calculations. In many well-known project management systems, the Gantt chart is essentially a picture that a manager builds manually: setting dates, moving tasks, adjusting dependencies. In practice, it is a plan maintained by hand. In QPM, the Gantt chart is live. It is generated by an algorithm and simultaneously accounts for estimation, priority, a person’s availability, and task dependencies. This means it is not a static plan, but a dynamic time model of the project.
In many systems, teams are forced to export data to Excel just to calculate something as basic as: Finish Date = Start Date + Estimation. This happens because such basic calculations are either not built into the system or require complex configuration. In the process, dependencies are often lost.
In QPM, the calculation logic is embedded directly into the system.
If the priority changes, the plan is recalculated.
If a team member's workload changes, the plan is recalculated.
If a new dependency appears, the plan is recalculated.
That is why the Gantt chart in QPM is a mathematical model of project execution, showing the real picture rather than an optimistic report.
6. Will We Finish on Time — and How Can We Predict It Ahead of Time?
In QPM, you can look ahead. By running a simulation (Run Simulation) in the Gantt Diagram, you can model how a project will evolve based on the team’s actual workload, task dependencies, and people’s availability. The system calculates the projected completion date. As a result, decisions are made not when the problem has already become obvious, but much earlier — when the situation can still be easily adjusted.
7. How QPM Reduces Time-to-Market?
The main cause of delays is not the complexity of tasks, but cognitive overload. The brain spends a significant amount of time loading new rules for each task. When a person switches from Task A to Task B, part of their attention remains attached to the first task. This creates cognitive friction. Without clear planning, a team can lose a substantial portion of its working time simply trying to understand: “What should we do next?”
QPM is an out-of-the-box solution. There is no need to configure agents, write prompts, set up complex integrations, or assign dedicated people to manage the system. Our platform enforces a structured way of working. We minimize chaos and build clear processes. Discipline is embedded in the tool itself, not in people’s heads. In essence, QPM becomes an objective mirror of your team’s work.
Chaos arises when a developer has five tasks “in progress”, but none are actually moving forward. QPM forces the team to focus: one active task—one priority, one focus. The executor does not constantly switch context. As a result, when returning to a previous task, the person does not waste time reloading the context. Every task switch costs time and money. QPM helps the team return to a linear, predictable workflow. Transparency replaces micromanagement. You no longer need to ask, “What’s the status of this task?” — the system clearly shows the active status. Chaos disappears where objective visibility of the process begins.
You cannot force everyone to be responsible, but you can give them a tool that makes it impossible to hide the absence of work. QPM creates a culture of transparency without unnecessary conversations. Forget about time trackers that people start and then forget about. Our system measures the time when a person is actually engaged in a task. This is not control for the sake of control, it is the foundation for fair compensation and realistic planning.
Our system does not allow a task to remain in the Active status without real activity. We reduce Time-to-Market (TTM) by identifying moments when development has stalled and highlighting potential risks. In traditional systems, developers often add an extra 30% of time to account for unexpected issues. In QPM, we see the actual focused work time. The result: products reach the market 20–30% faster simply by eliminating artificial delays. Instead of waiting until the end of the week to discover a delay, you can see deviations from the planned pace in real time.
8. How to Prevent Individual Employee Overload?
In real work environments, team overload often develops unnoticed. For example, one specialist may gradually take on more tasks simply because he is the most experienced, while other team members formally appear to be available. At first, everything seems normal, but deadlines begin to slip, and people start to burn out. In QPM, situations like this are addressed at the system level. Tasks are distributed automatically based on skills, competency levels, current workload, and employee availability. As a result, work is not concentrated around the strongest or most convenient performers but is balanced across available resources. If a team member is already busy, the system will not assign them a new task.
This approach helps maintain a stable work pace without hidden overload and unexpected delays.
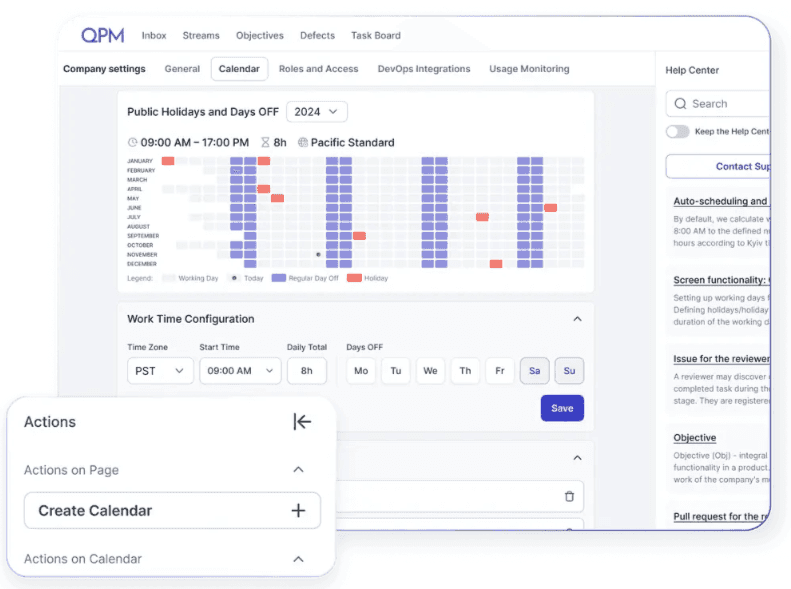
9. How to Account for Vacations, Sick Leave, and Other Availability Changes Without Manual Replanning?
QPM has a built-in calendar where each team member can set their status and mark when they are on vacation or sick leave. The system immediately receives this signal and recalculates the related dependencies. For example, if a key specialist goes on sick leave in the middle of an iteration, the traditional approach usually involves urgent messages, reviewing tasks, manually reassigning work, and trying to understand how this will affect deadlines. In QPM, the process is much simpler. The employee simply marks their absence in the calendar. The system immediately accounts for the change in availability, automatically recalculates timelines, adjusts dependencies, and, if necessary, assigns tasks to another available team member with the appropriate skills.
All changes in the project can be seen in the Gantt Diagram or the Relations Diagram.
10. How to Manage Dependencies Between Tasks, Teams, and Processes?
Dependencies are one of the most painful areas in any project. In most companies, they exist only in managers’ heads. One animator gets sick, and no one realizes that a month later, this could stall the entire development team. That happens because the interconnections are not properly calculated. Instead, they are communicated through people, chats, and calls. This is how communication chaos begins.
QPM is not just about drawing arrows — it is a system that understands the relationships between cross-team workflows. We solve the problem of communication chaos, where information is passed only through people.
Using the Gantt Diagram, you can see how a single change affects the project’s timeline. Through the Relations Diagram, you can understand how the process itself is structured and where the actual risk node lies.
This is a fundamentally different level of control. Dependencies no longer exist only in people’s heads — they become part of the system. Instead of manually identifying risks, you gain predictability and a transparent view of how teams interact.
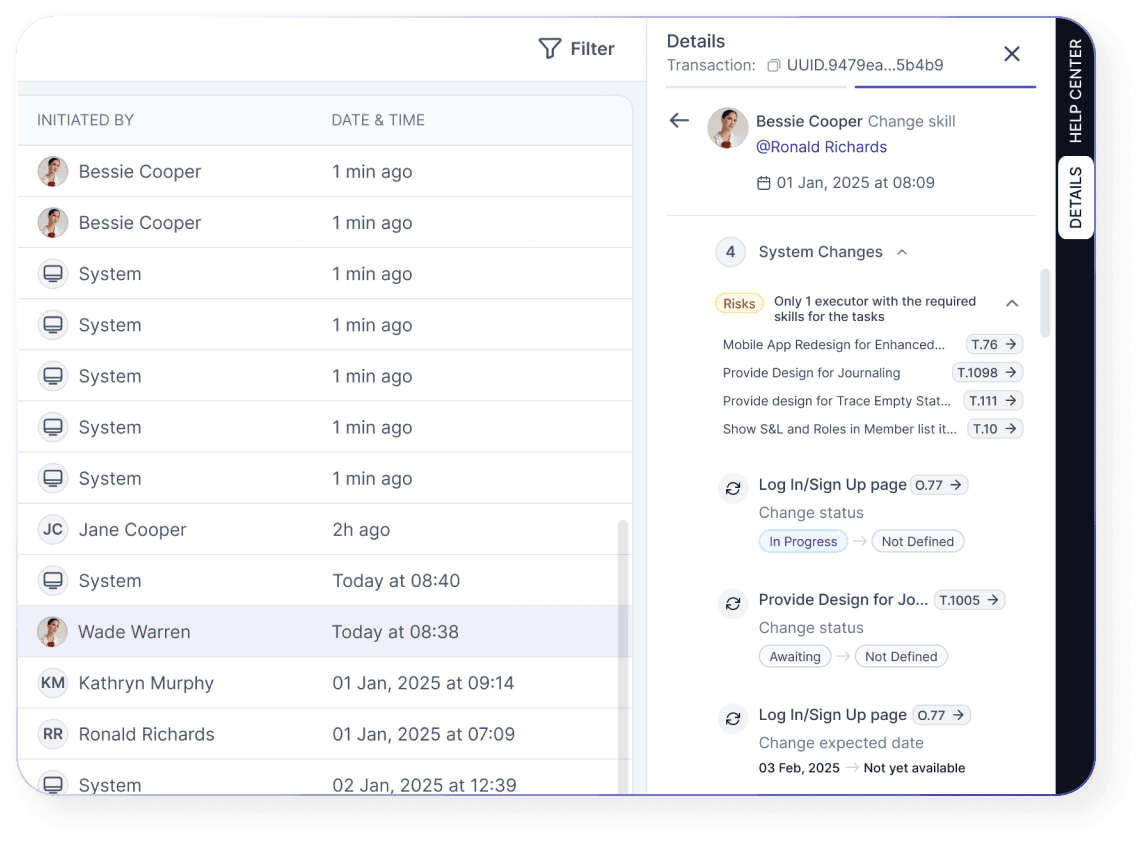
11. How to Manage Change History in a Project?
This issue is addressed in QPM through the Journaling feature. Every action performed on the platform is automatically recorded. You can see what each person has done within the system. For example, if an employee is on vacation and it is necessary to understand what work was being done or what changes were made, the Journaling feature can be used to track what has already been completed and where the work in the project was left. This makes it possible to quickly analyze situations, identify the reasons for deviations, and restore the sequence of events.
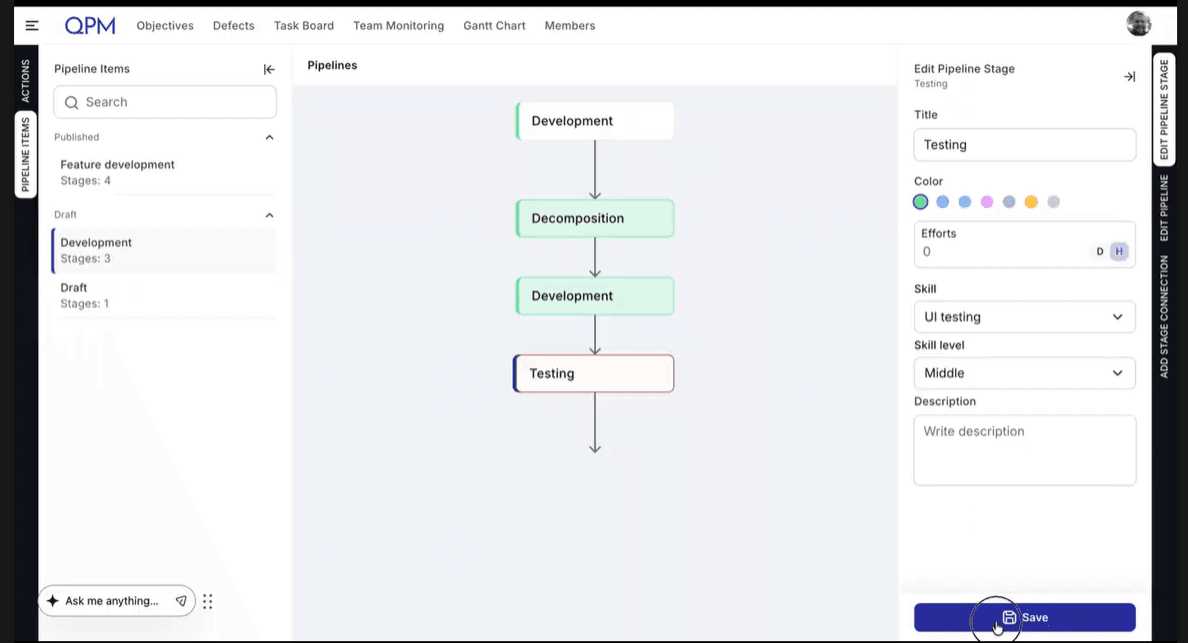
12. We Have Many Similar Goal Execution Scenarios — Is It Possible to Create Templates?
Yes, QPM provides the Pipeline mechanism specifically for such scenarios. Instead of manually recreating the same task structure each time, you can create a process template once by defining the required tasks, their logic, effort estimates, and the necessary skills and levels. The Pipeline is then simply linked to an Objective or Iteration, after which the system automatically generates the tasks, performs the planning, and assigns executors.
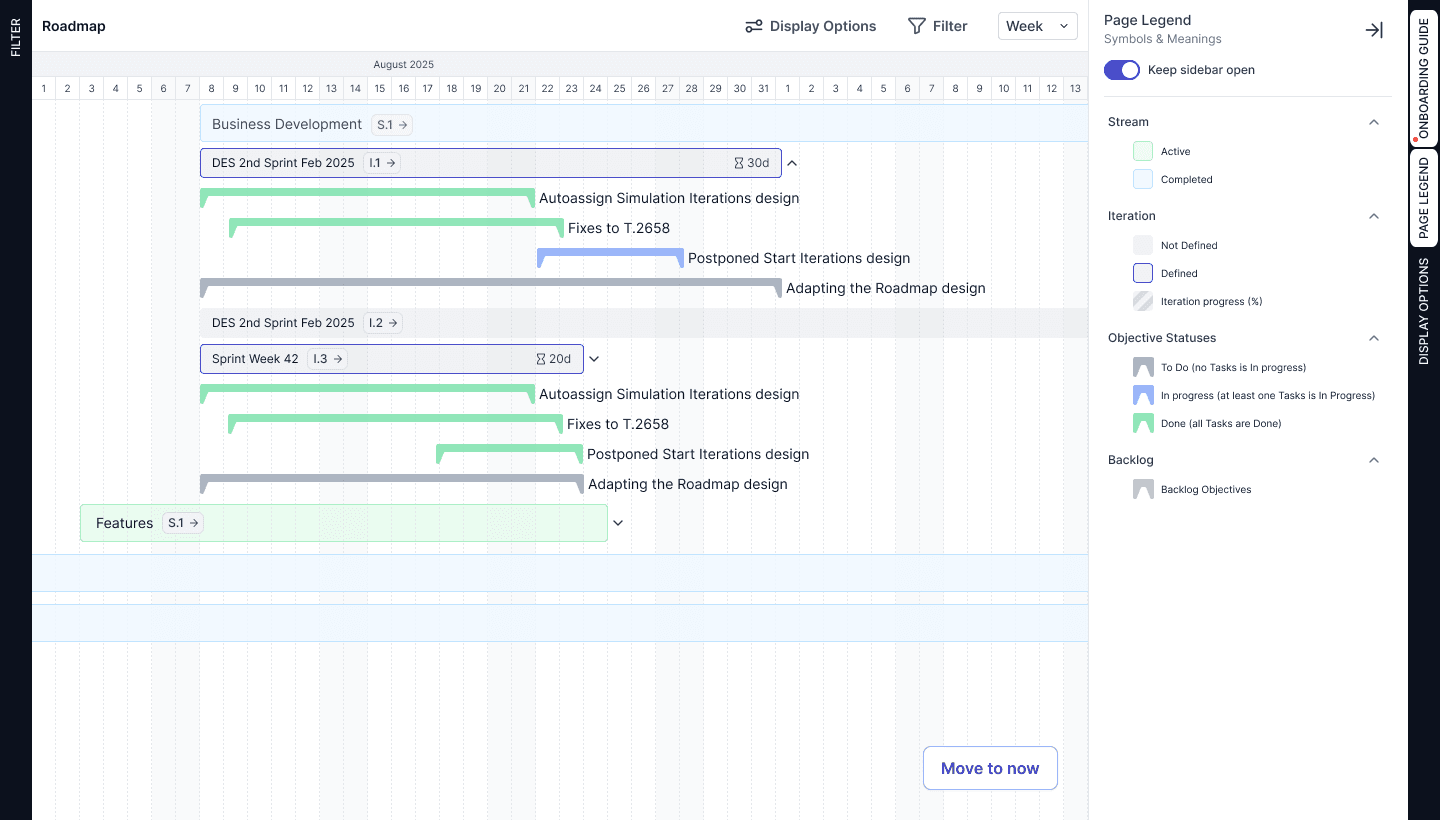
13. How the Roadmap Works in QPM
The Roadmap in QPM shows the entire work structure in a time-based logic. In a single timeline, you can see Streams, Iterations (the time period allocated to complete all tasks required to achieve a goal), and Objectives — what is planned, what is currently in progress, and what has already been completed. All statuses and progress updates occur automatically, ensuring the view always reflects the actual state of execution. You can adjust the scale, filter the data, and quickly evaluate progress without opening individual tasks. Essentially, it provides a strategic C-level overview of the project, reflecting the real execution dynamics rather than a static plan.
Conclusion: Project management becomes more complex not because of the number of tasks, but because of the growing number of interconnections, decisions, and constraints. This is exactly where businesses most often lose predictability, timelines, and control. QPM allows teams to manage this complexity systematically — when planning, resources, and execution operate within a single logic, project management stops being a constant struggle and becomes a stable, manageable process.